By Sateria Tinsley, Communications Team
The March 10th Dinner Meeting kicked off with an extended Professional Growth session "Microsoft Comes to the Westin”. David Huseonica of CloudAG and Laura Crawford of PM Resource a Group presented on MS Office 365 and MS Project Online. Both discussed cloud based solutions for Project Managers to be able to create and manage projects, track issues and risks for today's enterprise.
Back by popular demand - cash bar! All attendees were treated to the cash bar returning. We are asked to make best usage of this service as there is a cost to the Chapter associated with its availability. Lack of usage caused it to disappear. In order to keep it available, it will need to be utilized.
New to the meeting this month was a 5-minute Table Power Networking Session. Each member in attendance was treated to a table networking session led by a PMI Atlanta member at each table. Instead of sitting at the table and meeting only your table mates to the left and right of you, we had the pleasurable experience of meeting everyone at the table with 30-second elevator speeches.
The attendees were thrilled to hear the Chapter is ranked 3rd in the nation and 4th globally with only a few members short of surpassing #2 New Jersey. Doug Guice, VP Membership encouraged the group to bring in new members to assist the Chapter in rising in the rankings.
Caressa Bell, VP Operations, informed everyone that the post event surveys are different and we are listening. Examples include: February networking was in a tight hallway, so we provided more space this month and the aforementioned cash bar. The team reviews each response and are working to make changes according to the responses.
After these enthusiastic announcements, Larry Maccherone, Director of Analytics at Rally Software (who also sponsored this Dinner Meeting) presented “Quantifying The Impact of Agile”.
Agile can be perceived in different ways: a manifestation of values or list of principles, an emphasis on collaboration, a repackaging of spiral and iterative development concepts, or the overarching prioritization of adapting to change over following a plan. Software has had several shifts in perception over the years. These shifts tend to be reactions to environmental changes, similar to what occurs in nature. Take the flounder, for example. A flounder’s environment is the ocean floor. He lies on his side and has adapted so that both eyes are on one side of his head, because he only cares about feedback from above.
The movement between the different stages of software’s lifecycle used to be very expensive. Compilers ran for hours. Testing was labor-intensive. Distribution of a completed product involved physical media and could take months. In this environment, it was critical to minimize the number of times you went through these costly transitions. Fittingly, the emphasis for feedback was on the process: you could improve the checklists you used to stage-gate each of the transitions, with the hope of reducing rework that crossed backward over these expensive boundaries. Similarly, the success of a project minimally required that it be finished before funding ran out, so there was similar emphasis on the plan feedback.
Then the environment changed. The costs of compilation, testing, and distribution have been driven close to zero. The biggest threat to success is not that you’ll run out of money, but that you’ll miss your market window. “Rework” is no longer verboten. In fact, it’s much better to build something minimally usable --and then “rework” it based upon usage feedback--than it is to try to “build it right the first time.” Like the flounder who no longer needs feedback from below, we no longer value feedback on the process or the plan as much. Our most valuable feedback is on the product.
He’s been working hard to identify key perspective shifts necessary to successfully introduce measurement into an Agile development environment, and has coined the phrase, "Seven Deadly Sins of Agile Measurement" to capture this learning. Let’s look at the first of these Seven Deadly Sins.
Sin #1 - Using measurement as a lever to drive someone else's behavior
If feedback emphasis is key to the success of Agile, the key to effective Agile measurement is to think of measurement in terms of feedback, not as the traditional lever to motivate behavior. Using measurement as a lever often devolves into keeping score, which is where the dark side of measurement starts.
As an alternative to commonly used charts, he proposes the following:
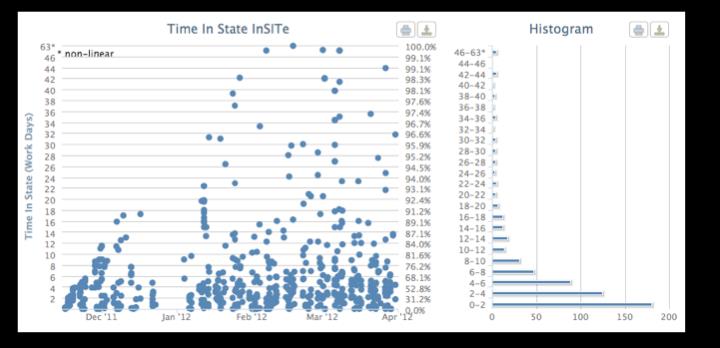
The primary difference is that it eliminates a red line and red dots. This visualization is designed to allow teams to explore their evidence, enabling learning and improvement.
Sin #2 - Unbalanced metrics
If you try to measure Agile development in a pre-Agile way, you’re bound to fail. Rally refers to these anti-patterns as the Seven Deadly Sins of Agile Measurement. The second sin has to do with the need for a balanced metrics regimen. The need for this is fairly readily apparent. If you focus on one aspect of performance (say productivity), other aspects will go down (quality, customer satisfaction, etc.).
You should launch a metrics feedback effort with at least one measure from each of these four areas: 1) Do it fast, 2) Do it right, 3) Do it when expected, and 4) Keep doing it. In the diagram, you can see populated each of these with at least one outcome sub-dimension.
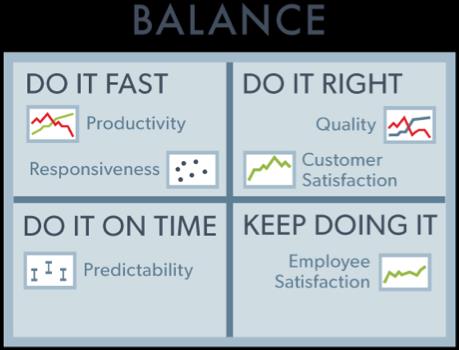
These outcome dimensions form the foundation of the Software Development Performance Index (SDPI), which quantifies insights about development work and provides feedback on how process and technology decisions impact a team’s performance. Of the metrics in each of the quadrants shown above (productivity, responsiveness, quality, predictability, customer satisfaction, and employee satisfaction), the first four can be extracted from ALM tools like Rally. The fifth and sixth metrics he recommends you gather via lightweight (maybe even single-question) surveys. (Note: they are also working on a seventh dimension which he calls the "build the right thing" dimension.)
With unbalanced metrics, you may not be measuring the right outcomes in the right proportions. The heavenly virtue that complements the sin of unbalanced metrics is, of course, to implement a balanced measurement regimen.
Sin #3 - Believing that metrics can replace thinking
If you believe that quantitative insight can replace qualitative insight, you are committing Sin #3. One of the primary principles of Agile is to trust the folks closest to the work, the ones with the most context to make decisions. If you think metrics can replace thinking, you are essentially telling your team, "We don't trust you." In an Agile world, the sort of quantitative evidence that you get from metrics must compliment qualitative insight, rather than seek to replace it.
In the best of circumstances, you can move in a virtuous cycle between qualitative and quantitative. Frequently, you will want to validate a performance hypothesis you have (qualitative insight) by using metrics (quantitative insight). The results of that analysis will lead to more questions. Creating a cycle of hunches that you validate via metrics is very powerful and can lead to huge leaps forward in decision-making. This requires support for ad-hoc analysis. Rally connectors like the Excel plugin as well as APIs, data access toolkits, custom grids, custom reports, and custom dashboard panels all help you achieve this heavenly state. Remember, metrics don't steer you: metrics illuminate the road so you can decide which way is the best way to go.
Sin #4 - Too-costly metrics
Sometimes it’s too expensive or burdensome to get the exact metric you want. Even when the actual cost--in time it takes for your developers to record extra information that helps calculate a certain metric--is low, the perceived burden can be much greater, especially in an Agile environment. Developers often are your most valuable resources and you do not want to burden them unnecessarily. You should only ask your developers to input manual data if they believe it leads to a measurement whose value exceeds the perceived burden (see Sin #1).
What this means is that in many cases, qualitative insight is your best alternative, but that's OK, maybe even desirable (see Sin #3). However, you can turn a qualitative perception into quantitative insight via a survey. That’s why two of the SDPI dimensions are customer satisfaction and employee engagement. Rally recommends that you use a very lightweight metric (maybe one question like net promoter score) for minimal burden while capturing a lot of value.
When assessing the value of a particular metric, make sure you include the “cost” of the perceived burden on your developers to record that metric. Qualitative insights can become valuable quantitative data.
Sin #5 - Using a convenient metric
Better measurement leads to better insights, which in turn lead to better decisions and eventually better outcomes. With this measurement chain of effect in mind, many people start by choosing measurements that are easy to acquire. However, measuring what’s easy often can drive the wrong behavior. Let’s use a sports analogy to illustrate this point:
In 2010, Monta Ellis of the Golden State Warriors was the ninth-highest scorer in the NBA. Carmelo Anthony of the Denver Nuggets was the eighth-highest scorer. Measuring individual scoring totals is easy, and you might assume that because these players were prolific scorers, their teams were winning games.
However, it turns out that the more they played, the less their teams won. Scoring is itself a function of two measures: the number of shots taken, and the percentage of those shots that go in the basket. These two “stars” have high measures for the former but low measures for the latter: they are high scorers because they take more shots, but their shooting percentages are quite low. Since they’re not making more opportunities for shots--their teams take almost exactly the same number of shots per game no matter how much they play--they are literally stealing shots from their teammates who might have a better chance of scoring.
So while the flow of learning goes from measures to outcomes, the best way to make measurement decisions is to start by identifying the desired outcomes. That’s why they are called ODIM:
better OUTCOMES ← better DECISIONS ← better INSIGHTS ← better MEASURES
Even the best strategy can fail in the execution, one small decision at a time. Another way to think about measurement in this context is that it provides the feedback to help your people know which decisions best align with your strategy.
Sin #6 - Bad analysis
Imagine setting a service level agreement, thinking that you would miss it in just 0.2% of your cases, but in reality you miss it in 1.0% of your cases. If you had allocated $200,000 as a contingency, you’d actually need $1,000,000. Yikes! Though the percentages seem small, you can see that their impact in dollars is not. This kind of bad analysis is actually a fairly easy mistake to make.
Sin #7 – Forecasting without discussing probability and risk
In any innovation process, there’s a limit to what can be known ahead of time. Although software projects start with a vision, Agile development allows software projects to unfold rather than be planned upfront. We can forecast what we know, but the unknowable often causes a larger impact on delivery time. In other fields of commerce, this is understood. Examples include insurance companies having to manage cash-flow in the face of uncertainty about future risks, or delays being a natural part of software innovation. These risks can be mitigated, and the associated costs minimized, by forecasting accordingly. Linear forecasts of only what is currently known will always fail to give an acceptably accurate result in the face of high uncertainty and risks. Managing uncertainty by measuring how much remains in the project is the only way to know if a linear forecast projection (burn-down) is an accurate prediction.
The presentation ended with Rally providing raffle winners with several books to take home and one lucky winner took home a gift certificate to a Rally class worth over $1,000.